Speed up Visual Studio by turning off the Source Control Plug-in

I don’t use the built in source control plug in Visual Studio as I use GitKraken instead, so Visual Studio’s plug-in just sat in the background not doing much as far as I could see.

Then out-of-the-blue I got a notification that it was slowing down Visual Studio and I should turn it off if I don’t rely on it. Fair enough, I don’t use it, it can go.

Open the Options dialog

Open the options dialog by going to the Tools→Options… menu item

Find the Source Control Plug in Section

Type Source Control Plug-in Selection in the search box and press enter

Change the drop down to None and then press OK.

If you have a solution open, it will likely tell you it has to close the solution.

That’s it!

Why is my app not responding? Oh… I’ve hit a breakpoint!

Have you ever run your app from Visual Studio to have it suddenly stop responding and you can’t immediately see why, only to discover that you’ve hit a breakpoint and didn’t realise because Visual Studio is now running behind the window you’re looking at (or on a monitor you weren’t looking at). Well, as of Visual Studio 17.4 (November 2022 release) you can now assign a sound to hitting a break point so that you get an audio warning when that happens.

To get this, first go to Tools–>Options, and typing “Audio Cues” into the search, then checking the “Enable Audio Cues” check box.

Next you have to open up the system sounds dialog in order to assign a sound to the event. From the Windows Start Menu search for “Change System Sounds”

And then selecting the “Sounds” tab, and scolling to the “Microsoft Visual Studio” section and selecting “Breakpoint Hit” as the event. You can then assign a sound to the event.

Once you apply this change, you will then get an alert sound when a breakpoint is hit while you are debugging your code.

We don’t have the budget for that

Over 20 years ago, I was asked by the company I worked for to fly out and help a client with an issue. It seems that they had trouble printing in certain scenarios and they wanted me to fix the problem.

The client did a lot of civil engineering projects and needed to print out large (A0 sized) maps with the details of the works to be completed marked up on them. However, when the map was rotated it often cropped the last few centimetres off the print, and often times this meant it cropped off the legend at the edge of the map or other important details.

I arrived at the client’s office and within a few hours I’d diagnosed the issue. When the map was printed with north pointing up everything was fine. Same for a rotation of 90, 180 or 270 degrees. But any other angle and the print out would be cropped to some degree or another.

The software used some optimisations for the multiple of 90 degree rotations, but couldn’t do that for other arbitrary rotations. As a result more memory was being used…. and somehow that translated into the print being cropped.

So, within a few hours of being on-site I had worked out what the issue was. I found out the right type of memory needed and how much, and I told the client.

“Sorry, we don’t have the budget for that,” I was told. “We need you to find a way for the software to use less memory”.

So I told them that would take me a while and would certainly cost more than my company was charging them to fly me out, put me up in a hotel, and billing them for my time once I was actually on site. In fact, the memory upgrade would cost somewhere around 1 or 2 days of my time, whereas I had no idea how long it would take me (if it was even possible) to re-write the software to do what they wanted.

They were adamant that I stay and find a software solution to their problem as they had money in a different budget that they could spend on my time. So, for the next few weeks I flew out each Monday, was put up in a hotel, and flew home on the Friday trying to find a software solution to their problem.

Then the money in the budget they were using to pay for my time ran out too. They had paid the company I worked for the equivalent of about 15 to 20 memory upgrades by this point.

About 3 months later I got an email from one of the people in that office to say they had started a new financial year, had got a new budget, and had bought the memory upgrade I suggested they needed on day one. It had worked perfectly. The printouts were no longer being cropped regardless of how the map was being rotated.

How to Undelete a Branch in Git

About a month ago I deleted a branch that I thought I wasn’t going to need. The ticket had been parked, then put back in the backlog and there were lots of discussions about what actually needed to be done and it looked like the work wasn’t going to be needed, at least not in its current form. So, the branch got deleted.

Then things started moving again and I wanted some of the code in the branch that I’d deleted.

When you delete a branch in Git it doesn’t actually delete the commits. It just deleted the reference to the branch, which is essentially just a pointer to the commit at the head of that branch. You can prune these orphaned commits to really get rid of them, but if you do nothing then they just hang around.

Steps to undelete a branch

First, in the terminal or shell use the command:

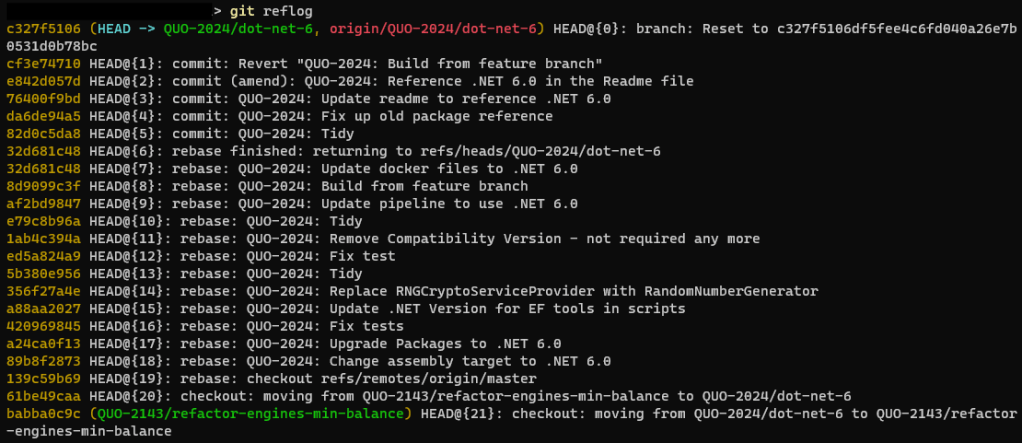
git reflog

And then you’ll see all the commits in the repository, including the deleted ones.

Start of the reflog output

Once you find the commit you want to retrieve then you can create a new branch at that commit like this:

git checkout -b "<branch-name>" "<head-ref-or-commit-sha>"

e.g.

Example creating branch for a specific commit

Which makes the commit and its predecessors available again as a branch.

e.g.

GitKraken tree of the repo with the old branch back in place

And there you have it.

Why is there a difference between decimal 0 and 0.0?

const decimal ZeroA = 0M;
const decimal ZeroB = 0.0M;

They’re the same thing, right? Well, almost. The equality operator says they’re the same thing.

bool areSame = ZeroA == ZeroB; // is true

But internally they’re not, and I’ll get to that in a moment. First, a bit of background.

How did I get here?

I first noticed a bit of an issue in some unit tests. I use Verify Tests in some tests to check the output of the API, which is JSON. In one test for some code I’d refactored, the value 0M was being set on a property if the underlying calculation had nothing to do. The previous code had done this in a different place and the value was 0.0M which should be the same thing. Surely? They’re both zero. But the API’s JSON output was different and Verify Test flagged that as a test fail because it is just doing a text diff on the output against a known good verified output.

That sounds like it could lead to brittle tests, and to some extent that’s correct, however, what it does is allow us to ensure that the external API does not accidentally change due to some internal changes. Some clients can be quite sensitive to change, so this is important to us.

To show you what I mean, here’s a little code:

public class DecimalDto
{
    public decimal Zero { get; set; } = 0M;
    public decimal ZeroWithDecimalPoint { get; set; } = 0.0M;
}

class Program
{
    static void Main(string[] args)
    {
        var obj = new DecimalDto();
        var jsonString = JsonSerializer.Serialize(obj);
        Console.WriteLine(jsonString);
    }
}

The output is:

{"Zero":0,"ZeroWithDecimalPoint":0.0}

So that’s somehow retaining the fact that I put a decimal point in one but not the other. That doesn’t happen if I change the data type to a double.

The code for the double looks like this:

public class DoubleDto
{
    public double Zero { get; set; } = 0;
    public double ZeroWithDecimalPoint { get; set; } = 0.0;
}
class Program
{
    static void Main(string[] args)
    {
        var obj = new DoubleDto();
        var jsonString = JsonSerializer.Serialize(obj);
        Console.WriteLine(jsonString);
    }
}

And the output looks like this:

{"Zero":0,"ZeroWithDecimalPoint":0}

Both are the same regardless of whether we put a decimal point in the code.

Lets dig a bit deeper

So, there must be some sort of difference? What is it?

The documentation for public static int[] GetBits (decimal d); gives a clue.

The binary representation of a Decimal number consists of a 1-bit sign, a 96-bit integer number, and a scaling factor used to divide the integer number and specify what portion of it is a decimal fraction. The scaling factor is implicitly the number 10, raised to an exponent ranging from 0 to 28.

https://docs.microsoft.com/en-us/dotnet/api/system.decimal.getbits?redirectedfrom=MSDN&view=net-5.0

That suggests that you may get multiple binary representations of the same number by modifying the exponent.

0 * 10y = 0

Here are different representations of zero depending on how many places we add after the decimal point.

Decimal    96-127    64-95     32-63     0-31 (bits)
    0M =   00000000  00000000  00000000  00000000
  0.0M =   00010000  00000000  00000000  00000000
 0.00M =   00020000  00000000  00000000  00000000

It becomes a little more apparent how this is working if we use the number 1:

Decimal    96-127    64-95     32-63     0-31 (bits)
    1M =   00000000  00000000  00000000  00000001
  1.0M =   00010000  00000000  00000000  0000000A
 1.00M =   00020000  00000000  00000000  00000064
1.000M =   00030000  00000000  00000000  000003E8

On the left is the exponent part of the scaling factor (at bits 112-117), on the right (bits 0-95) is the integer representation. To get the value you take the integer value and divide by the scaling factor (which is 10y) so the calculations for each above are:

1 / (10^0) = 1M
10 / (10^1) = 1.0M
100 / (10^2) = 1.00M
1000 / (10^3) = 1.000M

Why did the JSON output differently?

When converting a number to a string the .ToString() method uses the precision embedded in the decimal to work out how many decimal places to render with trailing zeros if necessary, unless you specify that explicitly in the format of the string.

The JSON serialiser does the same. It uses the “G” format string by default as does the .ToString() method.

Can I do anything about it?

Not really, not if you are using the System.Text.Json serialiser anyway. (I haven’t looked at what Newtonsoft.Json does). Although you can add your own converters, you are somewhat limited in what you can do with them.

If you use the Utf8JsonWriter that is supplied to the JsonConverter<T>.Write() method that you need to override, then you have a limited set of things you can write, and it ensures that everything is escaped properly. Normally this would be quite helpful, but it has a WriteNumberValue() method that can accept a decimal, but no further options, so you’ve not progressed any. You can format the string yourself and use a WriteStringValue() but you’ll get a pair of quotations marks around the string you’ve created.

There are no JsonSerializerOptions for formatting numbers, and I can see why not. It would be too easy to introduce errors that make your JSON incompatible with other systems.

There are arguments that if you are writing decimal values you should be treating them as strings in any event.

  • decimal values are usually used for financial information and the JSON parsers on the other end is not guaranteed to convert the number correctly, usually defaulting to a floating point number of some kind, which may cause precision to be lost. For example PayPal’s API treats money values as strings.
  • Strings won’t get converted automatically by the parser.
  • JavaScript itself doesn’t support decimal values and treats all numbers as floating point numbers.

There are options for reading and writing numbers as strings, and with that you can then create your own JsonConverter<decimal> that formats and parses decimals in a way that allows you to specify a specific fixed precision, for example.

At it’s simplest the class could look like this:

public class FixedDecimalJsonConverter : JsonConverter<decimal>
{
    public override decimal Read(
        ref Utf8JsonReader reader,
        Type typeToConvert,
        JsonSerializerOptions options)
    {
        string stringValue = reader.GetString();
        return string.IsNullOrWhiteSpace(stringValue)
            ? default
            : decimal.Parse(stringValue, CultureInfo.InvariantCulture);
    }

    public override void Write(
        Utf8JsonWriter writer,
        decimal value,
        JsonSerializerOptions options)
    {
        string numberAsString = value.ToString("F2", CultureInfo.InvariantCulture);
        writer.WriteStringValue(numberAsString);
    }
}

And you can add that in to the serialiser like this:

JsonSerializerOptions options = new ()
{
    Converters = { new FixedDecimalJsonConverter() },
};

var obj = new DecimalDto(); // See above for definition
var jsonString = JsonSerializer.Serialize(obj, options);
Console.WriteLine(jsonString);

Which now outputs:

{"Zero": "0.00","ZeroWithDecimalPoint": "0.00"}

ReSharper test runner still going after tests complete

I’ve been writing some tests and I got this message:

[RIDER LOGO] Unit Test Runner

The process ReSharperTestRunner64:26252 has finished running tests assigned to it, but is still running.

Possible reasons are incorrect asynchronous code or lengthy test resource disposal. If test cleanup is expected to be slow, please extend the wait timout in the Unit Testing options page.

It turns out that because I was setting up an IHost as part of my test (via a WebApplicationFactory) that it was what was causing issues. Normally, it would hang around until the application is told to terminate, but nothing in the tests was telling it to terminate.

The culprit was this line of code:

var factory = new WebApplicationFactory<Startup>().WithWebHostBuilder();

The factory is disposable and I wasn’t calling Dispose() explicitly, or implicitly via a using statement.

The fix to this was simply to wrap the returned WebApplicationFactory<T> in a using block and the test running completed in a timely manner at the end of the tests.

using var factory = new WebApplicationFactory<Startup>()
.WithWebHostBuilder();

or, if by preference, or using an older version of C#:

using (var factory = new WebApplicationFactory<Startup>().WithWebHostBuilder())
{
// do stuff with the factory
}

Although this was running in JetBrains Rider, it uses ReSharper under the hood, so I’m assuming this issue happens with ReSharper running in Visual Studio too.

How to: Tell if a PowerShell script is running as the Administrator

$currentPrincipal = New-Object Security.Principal.WindowsPrincipal([Security.Principal.WindowsIdentity]::GetCurrent())
if (-not ($currentPrincipal.IsInRole([Security.Principal.WindowsBuiltInRole]::Administrator)))
{
    Write-Warning "This script needs to be running as the administrator."
    Exit 1
}

Write-Host "You are running as the administrator."

This script gets the current Windows Identity, then queries it to find out if it has the appropriate role.

Ensure Controller actions/classes have authorisation

A couple of years ago I wrote a unit test to ensure that all our controller actions (or Controller classes) had appropriate authorisation set up. This ensures we don’t go to production with a new controller or action that falls back to the default authorisation. We must think about this and explicitly apply it.

I’ve not thought about that unit test much since then. But this week one of the developers on the team created some new controllers for some new functionality we have, and the unit test failed. Although he’d put an [Authorize] attribute on some of the controllers, he’d not done it for all. A common enough lapse. But thanks to this unit test, it was caught early.

Our build server reported it:

The provided expression
    should be
0
    but was
1

Additional Info:
    You need to specify [AllowAnonymous] or [Authorize] or a derivative on the following actions, or the class that contains them.
 * MVC.Controllers.CommunicationsPortalController.Index


   at Shouldly.ShouldlyCoreExtensions.AssertAwesomely[T](T actual, Func`2 specifiedConstraint, Object originalActual, Object originalExpected, Func`1 customMessage, String shouldlyMethod)
   at Shouldly.ShouldBeTestExtensions.ShouldBe[T](T actual, T expected, Func`1 customMessage)
   at Shouldly.ShouldBeTestExtensions.ShouldBe[T](T actual, T expected, String customMessage)
   at MVC.UnitTests.Controllers.ControllerAccessTests.All_Controller_Actions_Have_Authorisation() in G:\TeamCityData\TeamCityBuildAgent-3\work\7cc517fed469d618\src\MyApplication\MVC.UnitTests\Controllers\ControllerAccessTests.cs:line 52

The code for the unit test is in this GitHub Gist: https://gist.github.com/colinangusmackay/7c3d44775a61d98ee54fe179f3cd3f21

If you want to use this yourself, you’ll have to edit line 24 (Assembly mvcAssembly = typeof(HomeController).Assembly;) and provide a controller class in your project. It has also been written for NUnit, and we’re using Shouldly as the assertion library.

Creating a Throttle with an ActionBlock – Addendum (Cancelling)

In my previous post I described how to create a throttle with an action block so you wouldn’t have too many tasks running simultaneously. But what if you want to cancel the tasks?

In our use case, we have a hard-limit of 2 minutes to complete the work (or as much as possible). A typical run will take about 30-40 seconds. Sometimes due to network issues or database issues we can’t complete everything in that time, so we have to stop what we’re doing and come back later – and hopefully things will be better and we can complete our run.

So, we need to tell the ActionBlock to stop processing tasks. To do this we pass it a CancellationToken. When we’ve finished posting work items to the ActionBlock we tell the CancellationTokenSource to cancel after a set time. We also check the cancellation token from within our task for the cancelled state an exit at appropriately safe points.

// Before setting up the ActionBlock create a CancellationTokenSource
CancellationTokenSource cts = new CancellationTokenSource();

// Set up the ActionBlock with the CancellationToken passed in the options
ActionBlock<int> throttle = new ActionBlock<int>(
    action: i=>DoStuff(i),
    dataflowBlockOptions: new ExecutionDataflowBlockOptions
    {
        MaxDegreeOfParallelism = 3,
        CancellationToken = cts.Token
    });

// ...Other code  to post work items to the action block...

// After posting the work items, set the timeout in ms.
cts.CancelAfter(2000);

// Wrap the await up to catch the cancellation
Task completionTask = throttle.Completion;
try
{
    await completionTask;
}
catch (TaskCanceledException e)
{
    Console.WriteLine(e);
}

The code is available on GitHub: https://github.com/colinangusmackay/ActionBlockThrottle/tree/master/src/04.CancellingTasksInTheActionBlock

Things to watch for

If you start your timer (When you set cts.CancelAfter(...)) before you’ve posted your work items, it is possible for the cancellation to trigger before you’ve posted all your work items, in which case you should check the cancellation token as you’re posting your work items, otherwise you will be wasting time posting work items that will never be processed.

Creating a Throttle with ActionBlock

We have an application that needs to perform a repetitive task on many external services and record then aggregate the results. As the system has grown the number of external systems has increased which causes some issues as we originally just created a number of tasks and waited on them all completing. This overwhelmed various things as all these tasks were launched near simultaneously. We needed a way to throttle each task, so we used an ActionBlock, part of the Task Parallel Library’s System.Threading.Tasks.Dataflow package.

Basic setup

I’ve created a little application that does some “work” (by sleeping for random periods of a few milliseconds). It looks like this:

class Program
{
    private static byte[] work = new byte[100];
    static void Main(string[] args)
    {
        new Random().NextBytes(work);
        for (int i = 0; i < work.Length; i++)
        {
            DoStuff(i);
        }
        Console.WriteLine("All done!");
        Console.ReadLine();
    }

    static void DoStuff(int data)
    {
        int wait = work[data];
        Console.WriteLine($"{data:D3} : Work will take {wait}ms");
        Thread.Sleep(wait);
    }
}

Also available on GitHub: https://github.com/colinangusmackay/ActionBlockThrottle/tree/master/src/00.BasicSerialImplementation

This is the very basic application that I’ll be parallelising.

A simple ActionBlock

Here is the same program, but with the work wrapped in an ActionBlock. It is a bit more complex, and currently for little extra benefit as we’re not done anything to parallelise it yet.

class Program
{
    private static byte[] work = new byte[100];
    static async Task Main(string[] args)
    {
        new Random().NextBytes(work);

        // Define the throttle
        var throttle = new ActionBlock<int>(i=>DoStuff(i));
        
        // Create the work set.
        for (int i = 0; i < work.Length; i++)
        {
            throttle.Post(i);
        }

        // indicate that there is no more work 
        throttle.Complete();

        // Wait for the work to complete.
        await throttle.Completion;

        Console.WriteLine("All done!");
        Console.ReadLine();
    }

    static void DoStuff(int data)
    {
        int wait = work[data];
        Console.WriteLine($"{data:D3} : Work will take {wait}ms");
        Thread.Sleep(wait);
    }
}

Also available on GitHub: https://github.com/colinangusmackay/ActionBlockThrottle/tree/master/src/01.SimpleActionBlock

This does the same as the first version, by default an ActionBlock does not parallelise any of the processing of the work. All the work is still processed sequentially.

The producer and consumer run in parallel

I said before this is for “little extra benefit”. So I should explain what I mean by that. There is now some parallelisation between the producer and the consumer portions. The for loop that contains the throttle.Post(...) (the producer) is running in parallel with the calls to DoStuff() (the consumer). You can see this if you slow down the producer and introduce some Console.WriteLine(...) statements to see things in action.

This is some example output from that version of the code.

000 : Posting Work Item 0.
000 : Work will take 32ms
001 : Posting Work Item 1.
001 : Work will take 179ms
002 : Posting Work Item 2.
003 : Posting Work Item 3.
004 : Posting Work Item 4.
002 : Work will take 28ms
005 : Posting Work Item 5.
003 : Work will take 9ms
004 : Work will take 100ms
006 : Posting Work Item 6.
007 : Posting Work Item 7.
005 : Work will take 109ms
008 : Posting Work Item 8.
009 : Posting Work Item 9.

I slowed the producer by introducing a wait of 50ms between posting items. As you can see in the time it took to post 10 items (it is zero based) it had only processed 6 items, but the producer and consumer are running simultaneously, so it is not waiting until the producer has completed before it starts processing the items.

Available on GitHub: https://github.com/colinangusmackay/ActionBlockThrottle/blob/master/src/02.SimpleActionBlockShowingProducerConsumer

Setting the Throttle

Finally, we get to the point that we can set some sort of throttle. In our use case we had a lot of work to do, most of which was actually waiting for external systems to respond, but if we threw everything in at once it would be overwhelmed.

Now we can set up some parallelism. The ActionBlock can take some options in the form of an ExecutionDataflowBlockOptions object. It has many options, but the one we’re interested in is MaxDegreeOfParallelism. The creation of the action block now looks like this:

ActionBlock<int> throttle = new ActionBlock<int>(
    action: i=>DoStuff(i),
    dataflowBlockOptions: new ExecutionDataflowBlockOptions
    {
        MaxDegreeOfParallelism = 3
    });

In our example, we’re just going to set it to 3 for demonstration purposes, but you’ll likely want to experiment to see where you get the best results.

In the example application, I also added a small counter (tasksInProgress) to keep a count of the number of active tasks and added it to the Console.WriteLine(...) in the DoStuff(...) method. The output looks like this:

000 : Posting Work Item 0.
000 : [TIP:1] Work will take 34ms
001 : Posting Work Item 1.
001 : [TIP:2] Work will take 216ms
002 : Posting Work Item 2.
002 : [TIP:2] Work will take 177ms
003 : Posting Work Item 3.
003 : [TIP:3] Work will take 183ms
004 : Posting Work Item 4.
005 : Posting Work Item 5.
006 : Posting Work Item 6.
007 : Posting Work Item 7.
008 : Posting Work Item 8.
004 : [TIP:3] Work will take 15ms
009 : Posting Work Item 9.
005 : [TIP:3] Work will take 57ms
006 : [TIP:3] Work will take 85ms
010 : Posting Work Item 10.
... etc...

You can see at the start the number of simultaneously running tasks builds up to the MaxDegreeOfParallelism value that was set. So long as the producer part is producing work items faster than the consumer can consume them, the tasks in progress (TIP) will stay at or close to the MaxDegreeOfParallelism.

Code available on GitHub: https://github.com/colinangusmackay/ActionBlockThrottle/tree/master/src/03.MaxDegreesOfParallelismAsAThrottle